Continuing from the previous post, let's get into some of the more advanced things to get more out of your workbooks. Some of these might need further development on your part, but hopefully you'll be able to get an overview of how you could use the same techniques to fit your own use cases.
Storing complex configuration as hidden JSON
Sometimes you want to add complex data for sorting your views or logs in a certain way. One of the ways to accomplish this is storing that configuration data inside your workbook as a parameter. As your workbook code can be stored in a repository, this also allows you to include version control for all of your configs.
My use case in this example is to
- Provide SLO targets for specific API calls on latency
- The calls need to be separated into multiple logical groups, specifying what calls to show on what page of the workbook, and also specifying user journeys, as well as defining whether the specific call is part of a composite SLI.
One could definitely model this requirement in multiple ways. It's dependent on the data schema, and I'd suggest including some of these details directly into the logs. In my case, everything needs to be defined at the workbook level.
- First, let's start by creating a top level hidden parameter SliConfig_all. The settings should be as shown in the image below, a multiline field in JSON, getting the data from a Query.
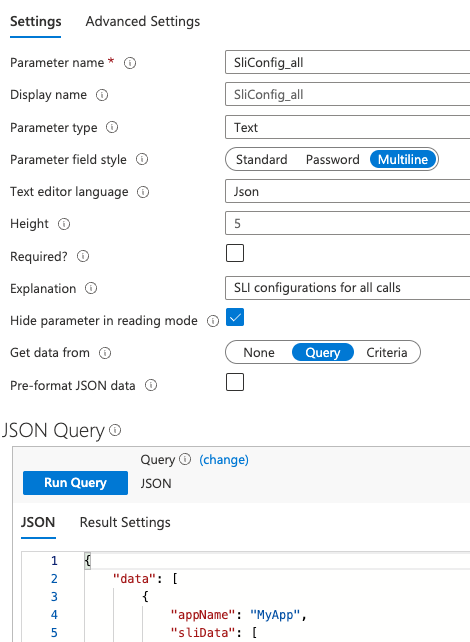
The data itself is a JSON object with a single "data" array, containing my configurtions for x number of "apps". These are the values we use to first specify what app data is shown per page. As shown in the previous post, I also have a "App" parameter in my workbook, that the pagination changes.
The schema of my JSON data for an App is about as follows:
{
    "appName": "MyApp",
	"sliData": [
        { "userFlow": "Buy Stuff", "flowPart": "Select Product", "operationName": "GET GetProduct/GetById", "inComposite": true, "latencySLI90": 350, "latencySLI99": 500 },
        <more objects...>
    ]
}
- Next, let's create a second parameter below the pagination links, SliConfig_parsed. This parameter is used to just parse out the App the workbook is currently interested about. Again, this parameter should get it's value from a Query like below
print sliJson = dynamic({SliConfig_all})
| mvexpand sliJson
| where sliJson.appName == "{App}"
| project data = todynamic(sliJson.sliData);
- Then the last thing left to do is just to use our data in a KQL query to produce a visualization. For example here I'm first joining the sliConfig data with the data from the requests table, and then running normal KQL logic against the result. The example is just a snippet of the full query, though.
let sliConfig_parsed = print sliJson = dynamic({SliConfig_parsed}) | mvexpand sliJson | evaluate bag_unpack(sliJson);
let ignoredCodes = dynamic({DefaultIgnoredCodes});
let userJourneys = "{UserJourneys}";
let data = requests
| where timestamp {TimeRange}
| where (resultCode !in (ignoredCodes))
| join kind=inner sliConfig_parsed on $left.name == $right.operationName

<query continues...>
Providing samples and links for specific events
A powerful feature of the workbooks is being able to pull information out of the KQL query results, and constructing links to other services based on the result. For example, if we want to get samples from a dataset and follow a single call through it's lifecycle in Application Insights. Let's see how to do that next.
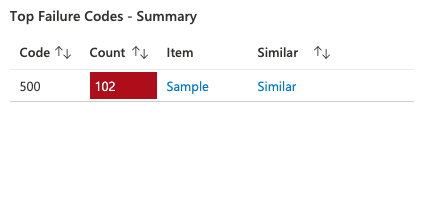
- In my case the query should produce at least a single itemId value. This can be anything that could identify a call in Application Insights data. Here's an example of the KQL query:
dataset
| summarize _count=sum(itemCount), Item = take_any(itemId) by resultCode
| sort by _count desc
| extend Similar = "Similar" // Functionality through column settings
| project-rename Count = _count, Code =  resultCode
- The rest of the configuration can be found in the column settings of the query editor. Let's see the Item column first:
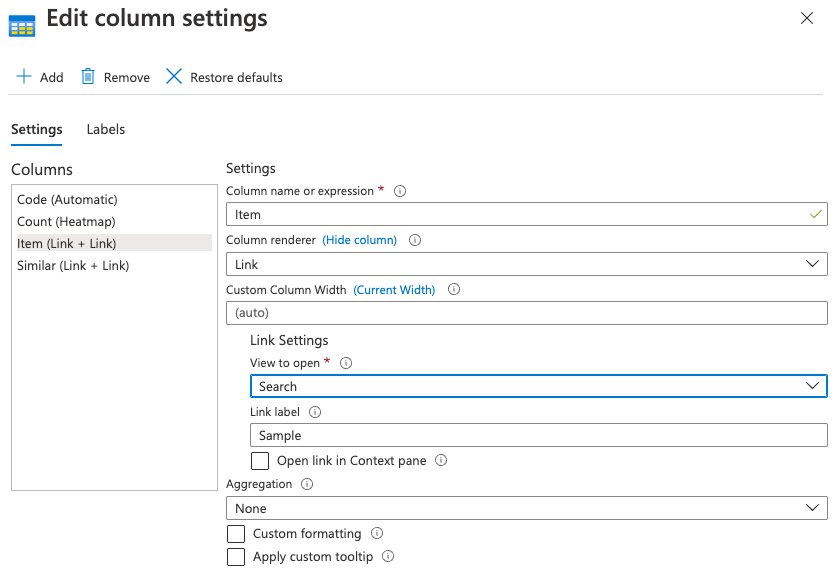
The important part here is the Link Settings -> View to Open. This drop down has automatically generated shortcuts for many of the views you might need. In my case this Search view just takes the ItemId as input, and searches from the Logs with that. The documentation for these can be found here.
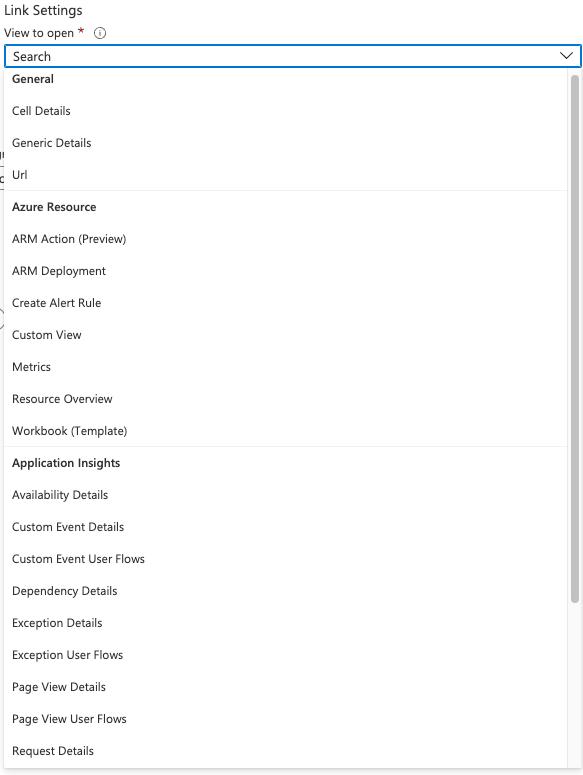
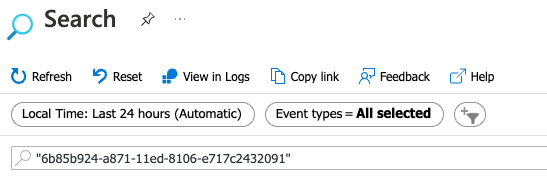
For the Similar link, I use a Custom View link that should use the same Search page from Application Insights, but set the query for both the operation name and the exception code. I also want to limit the time range a bit.
When you select Custom View, you will get a separate configuration menu option. You need to specify a Extension name and a View name. For App Insights, I was able to get these from looking at the URL produced by my Item link described above.

You can actually also pass a full URL in the "Get Custom View Settings from" selection, which makes this quite easy.
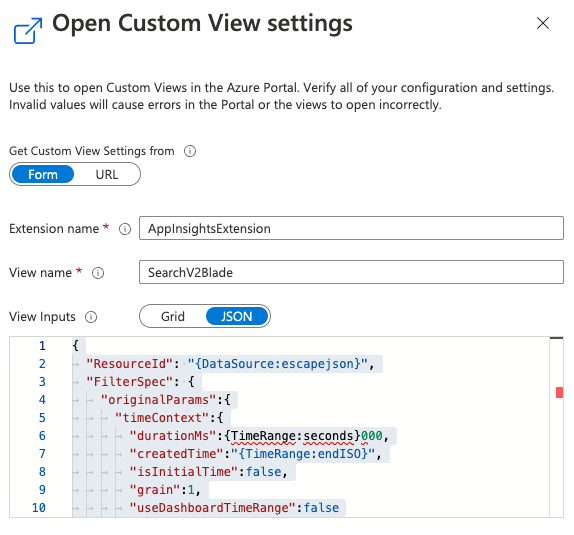
After you've pasted your URL in, you should have a view of the view inputs. These can be a bit tough to figure out, and at the time I created this I could not find too clear documentation on how to do this. Thankfully you are able to use the workbook data and parameters here to customize your query body. Here's what I ended up doing.
{
	"ResourceId": "{DataSource:escapejson}",
	"FilterSpec": {
		"originalParams":{
			"timeContext":{
				"durationMs":{TimeRange:seconds}000,
				"createdTime":"{TimeRange:endISO}",
				"isInitialTime":false,
				"grain":1,
				"useDashboardTimeRange":false
			},
			"searchPhrase":{
				"originalPhrase":"\"{Code_column}\" \"{SelectedOperation}\""
			}
		}
	}
}
And that's it!
In the next and final part, I'll quickly take a look at how would one handle the DevOps and Development flow of these workbooks.